CPI, the inflation report, explained. The monthly number that moves rates, bonds and stock
By Nexqual Desk ·
CPI, the inflation report, explained. The monthly number that moves rates, bonds and stocks.
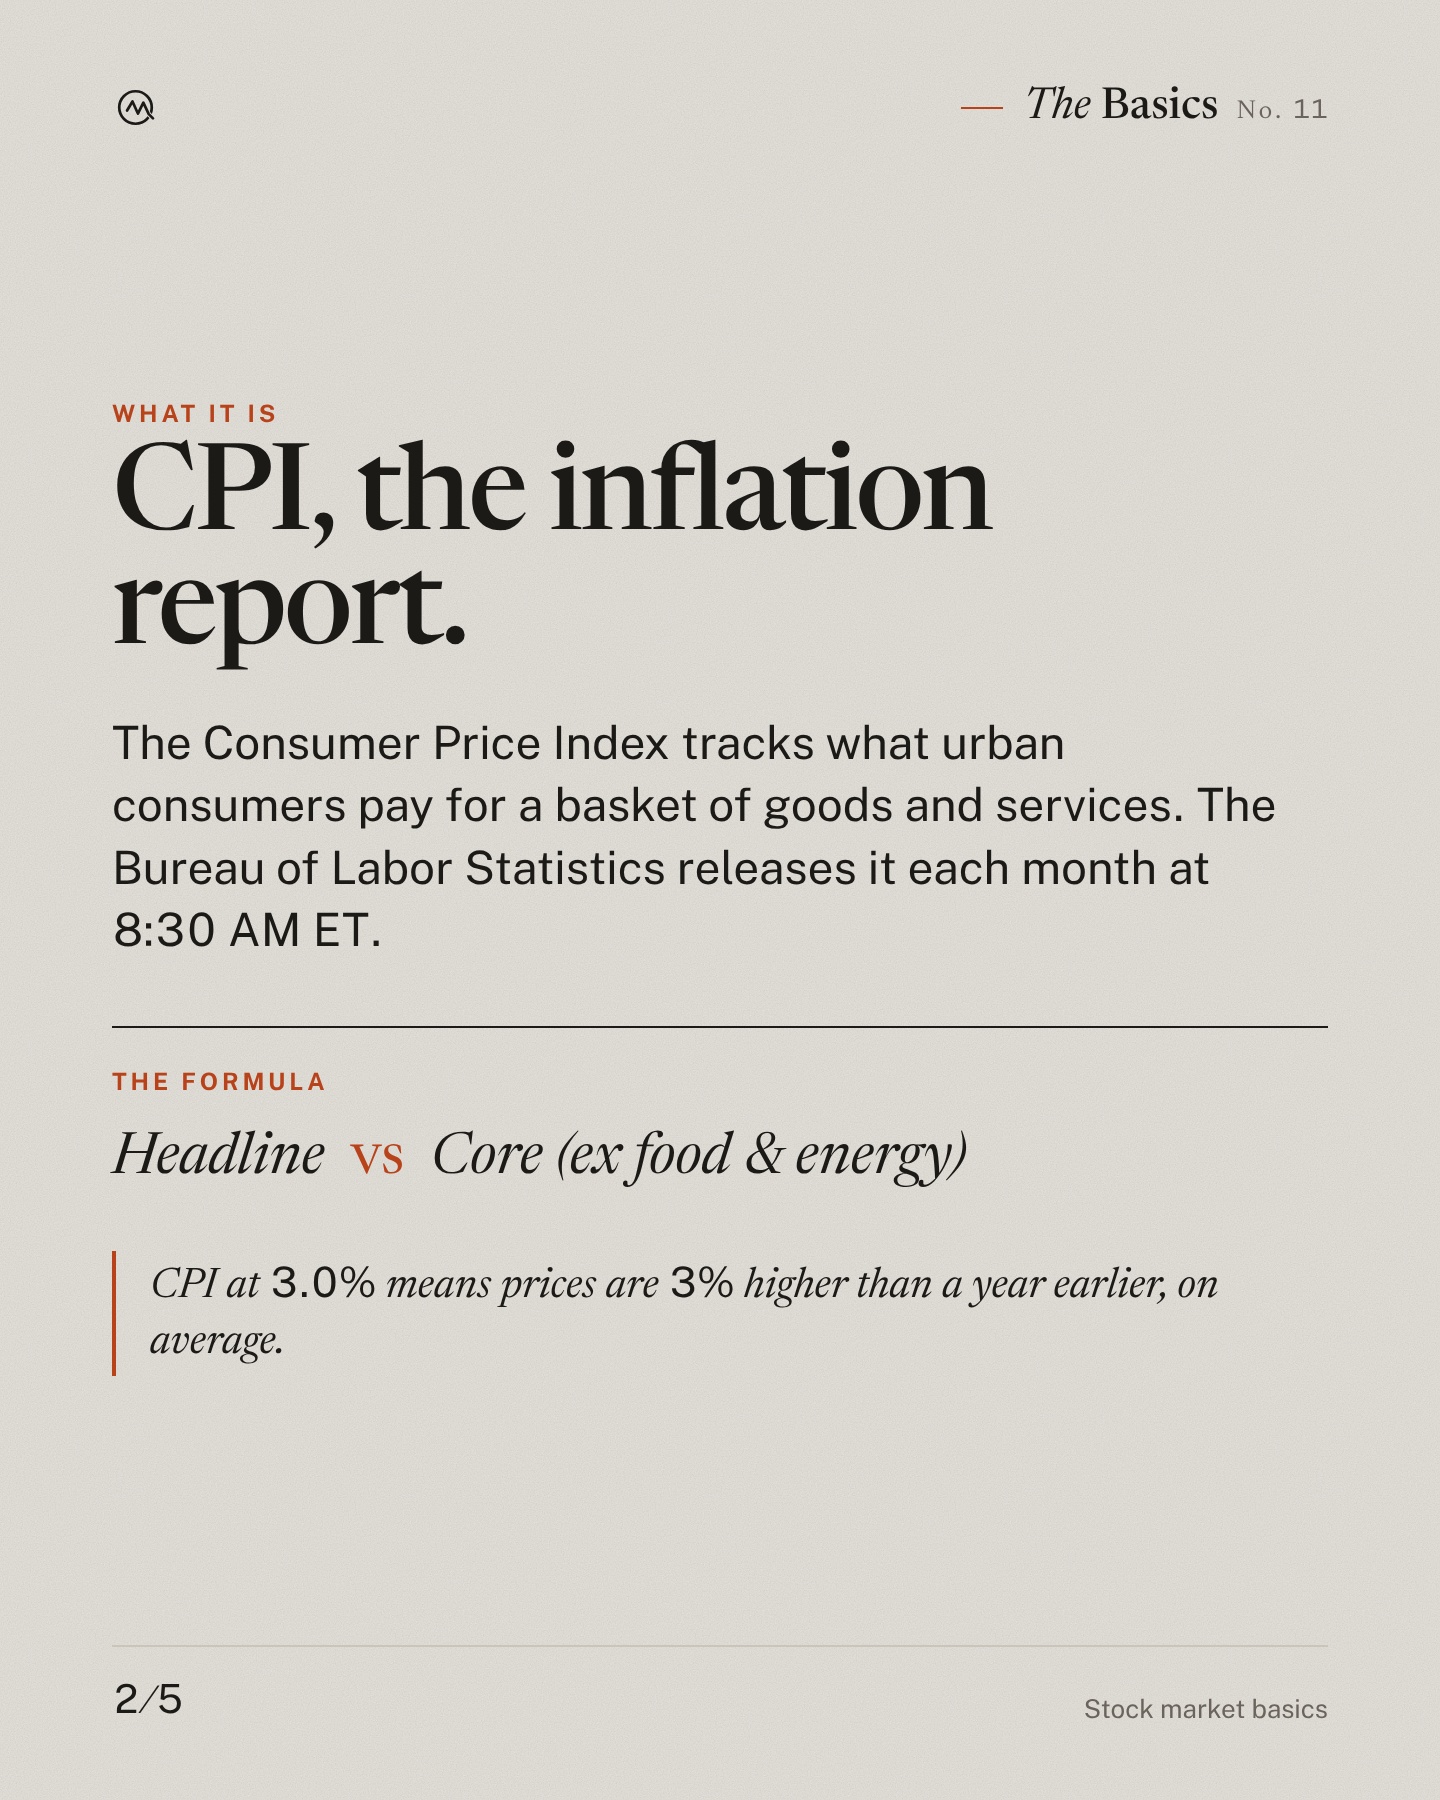
The Consumer Price Index tracks what urban consumers pay for a basket of goods and services. The Bureau of Labor Statistics releases it each month at 8:30 AM ET.
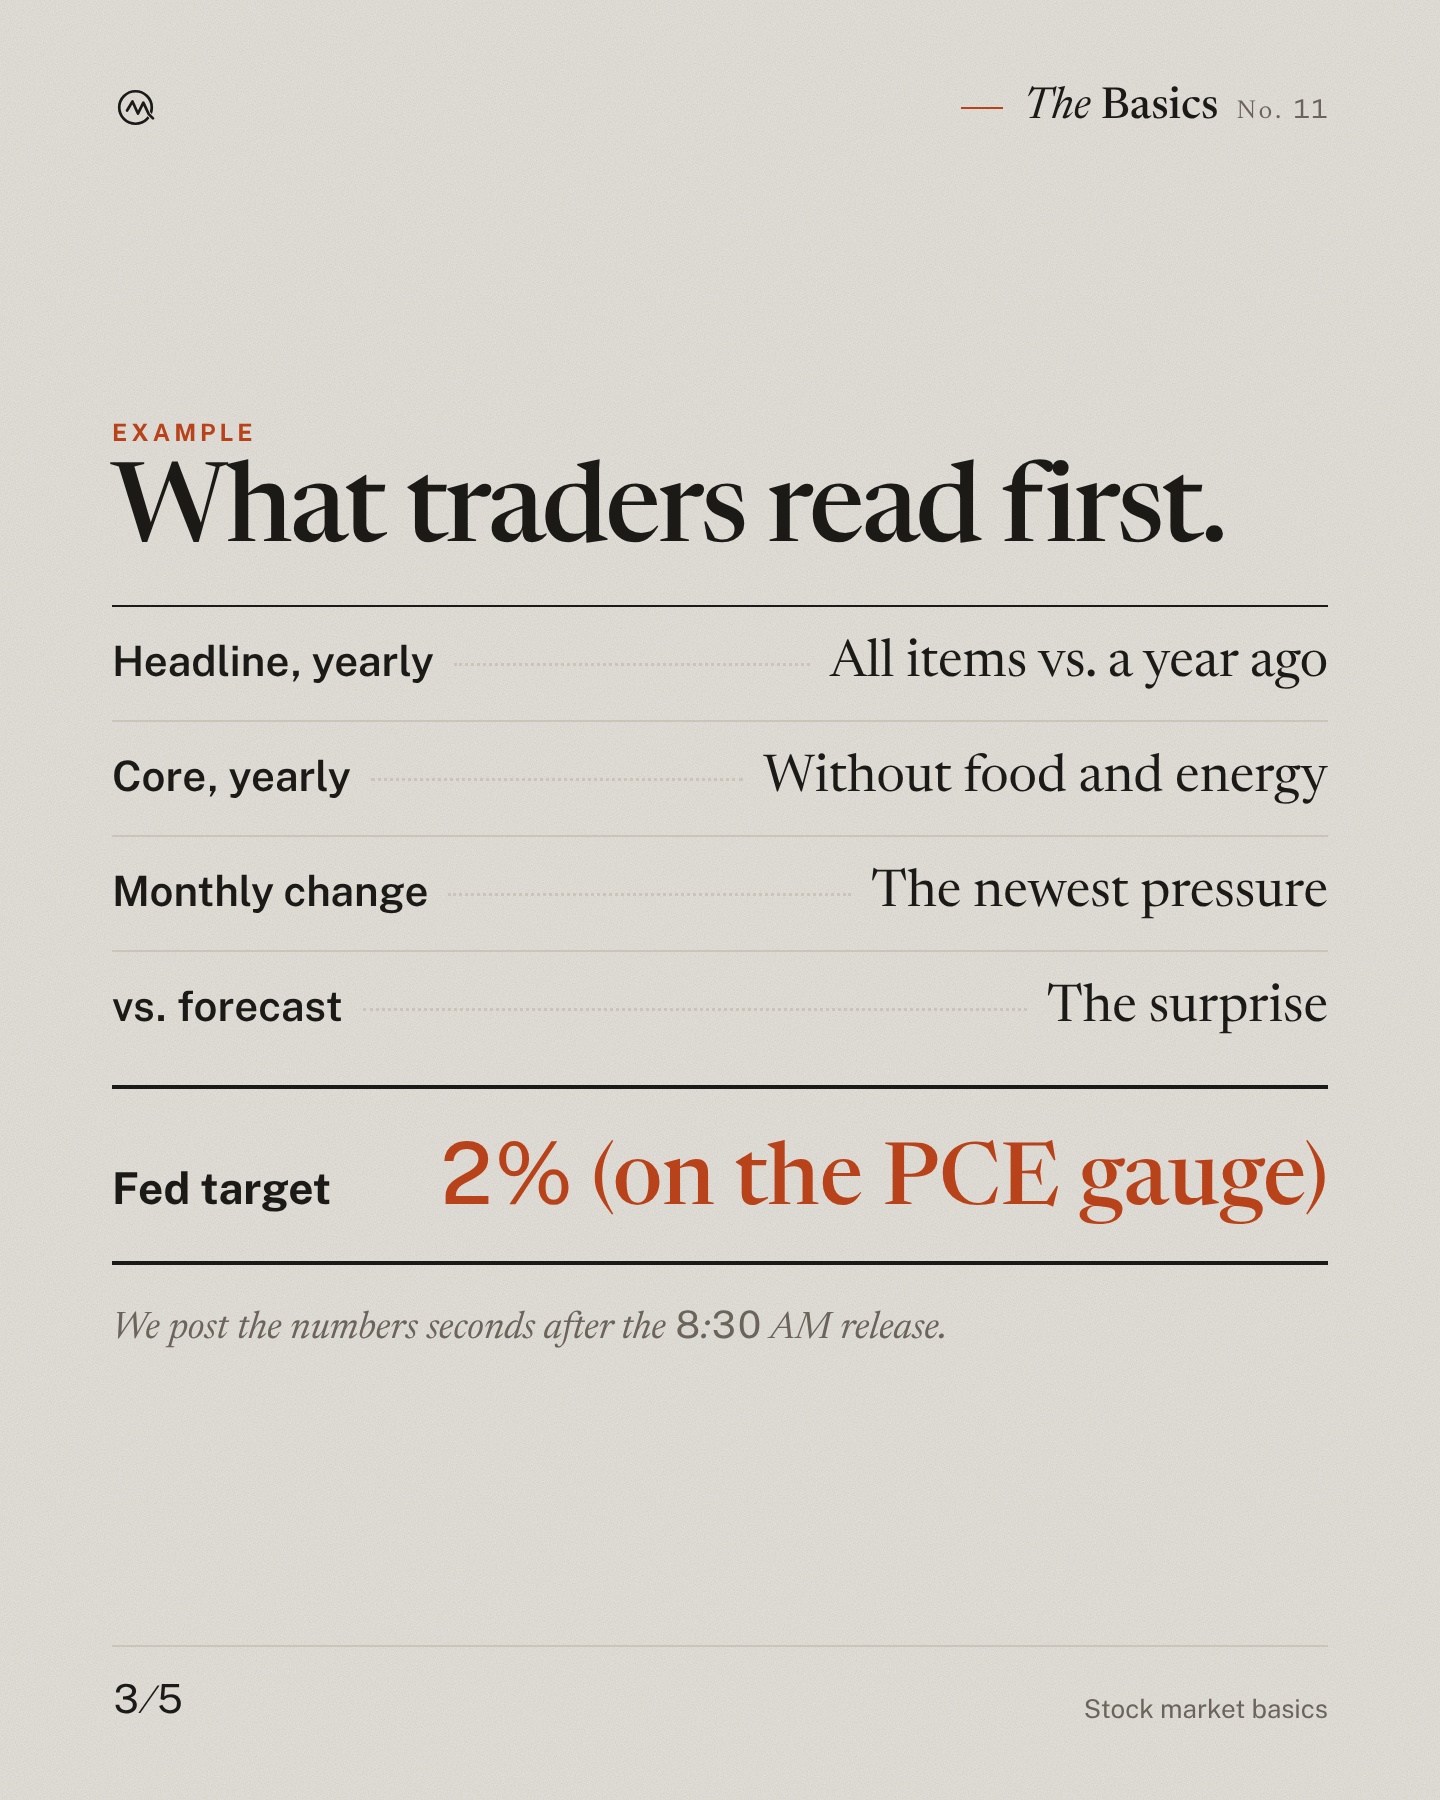
Headline vs Core (ex food & energy)
CPI at 3.0% means prices are 3% higher than a year earlier, on average.
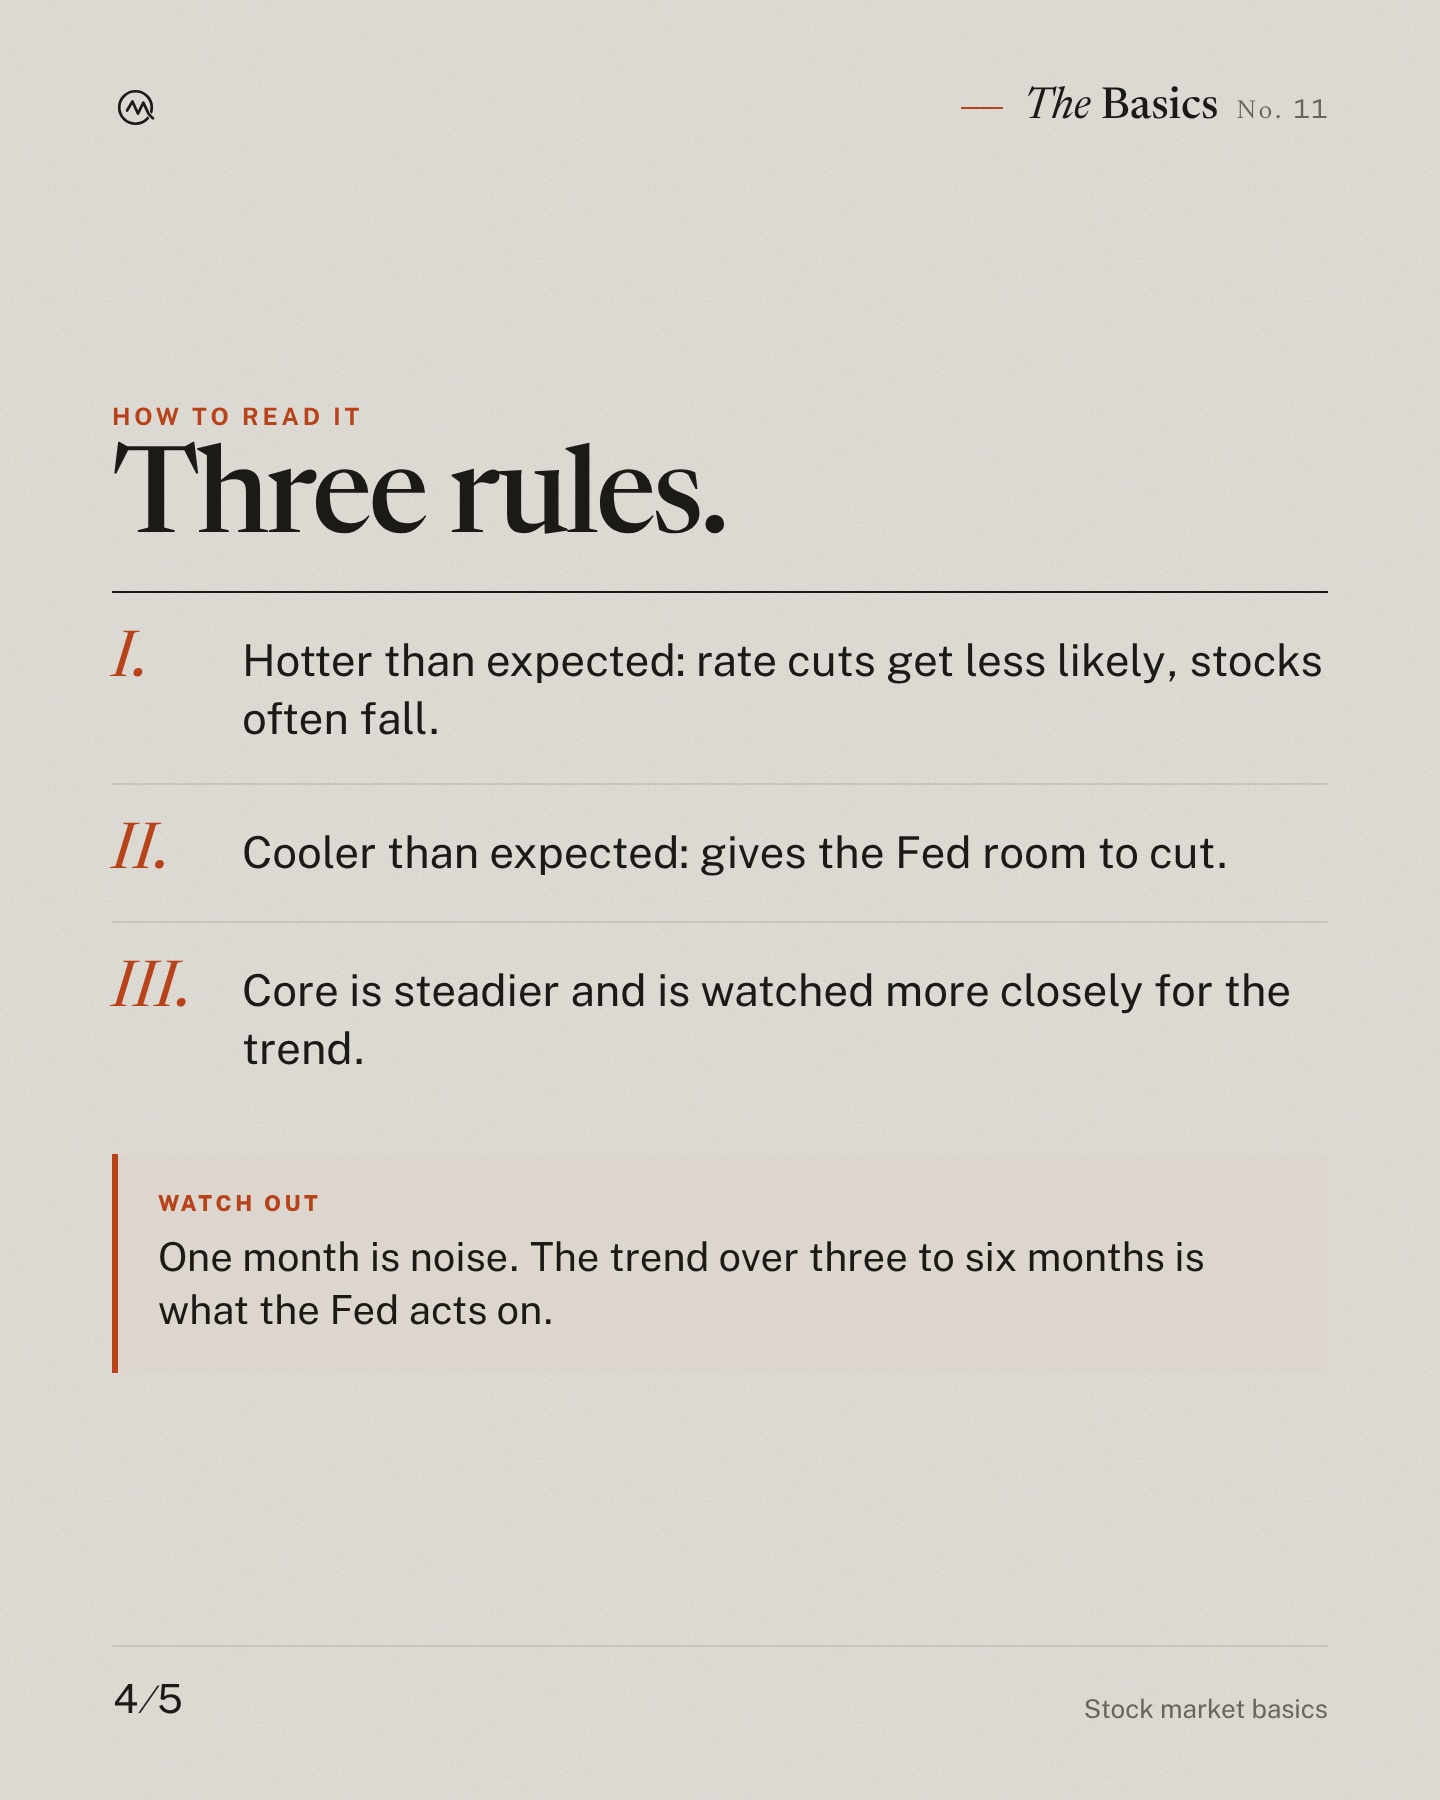
How to read it:
• Hotter than expected: rate cuts get less likely, stocks often fall.
• Cooler than expected: gives the Fed room to cut.
• Core is steadier and is watched more closely for the trend.
Watch out: One month is noise. The trend over three to six months is what the Fed acts on.
Next up: Beta.
Education only. Not financial advice.
0 likes
Posted on Nexqual Sonar — the social network for the stock market. Not financial advice.