Forward P/E, explained. The P/E based on next year’s expected profits.
By Nexqual Desk ·
Tickers: $AAPL $AMZN $MSFT $GOOGL $META $NVDA
Forward P/E, explained. The P/E based on next year’s expected profits.
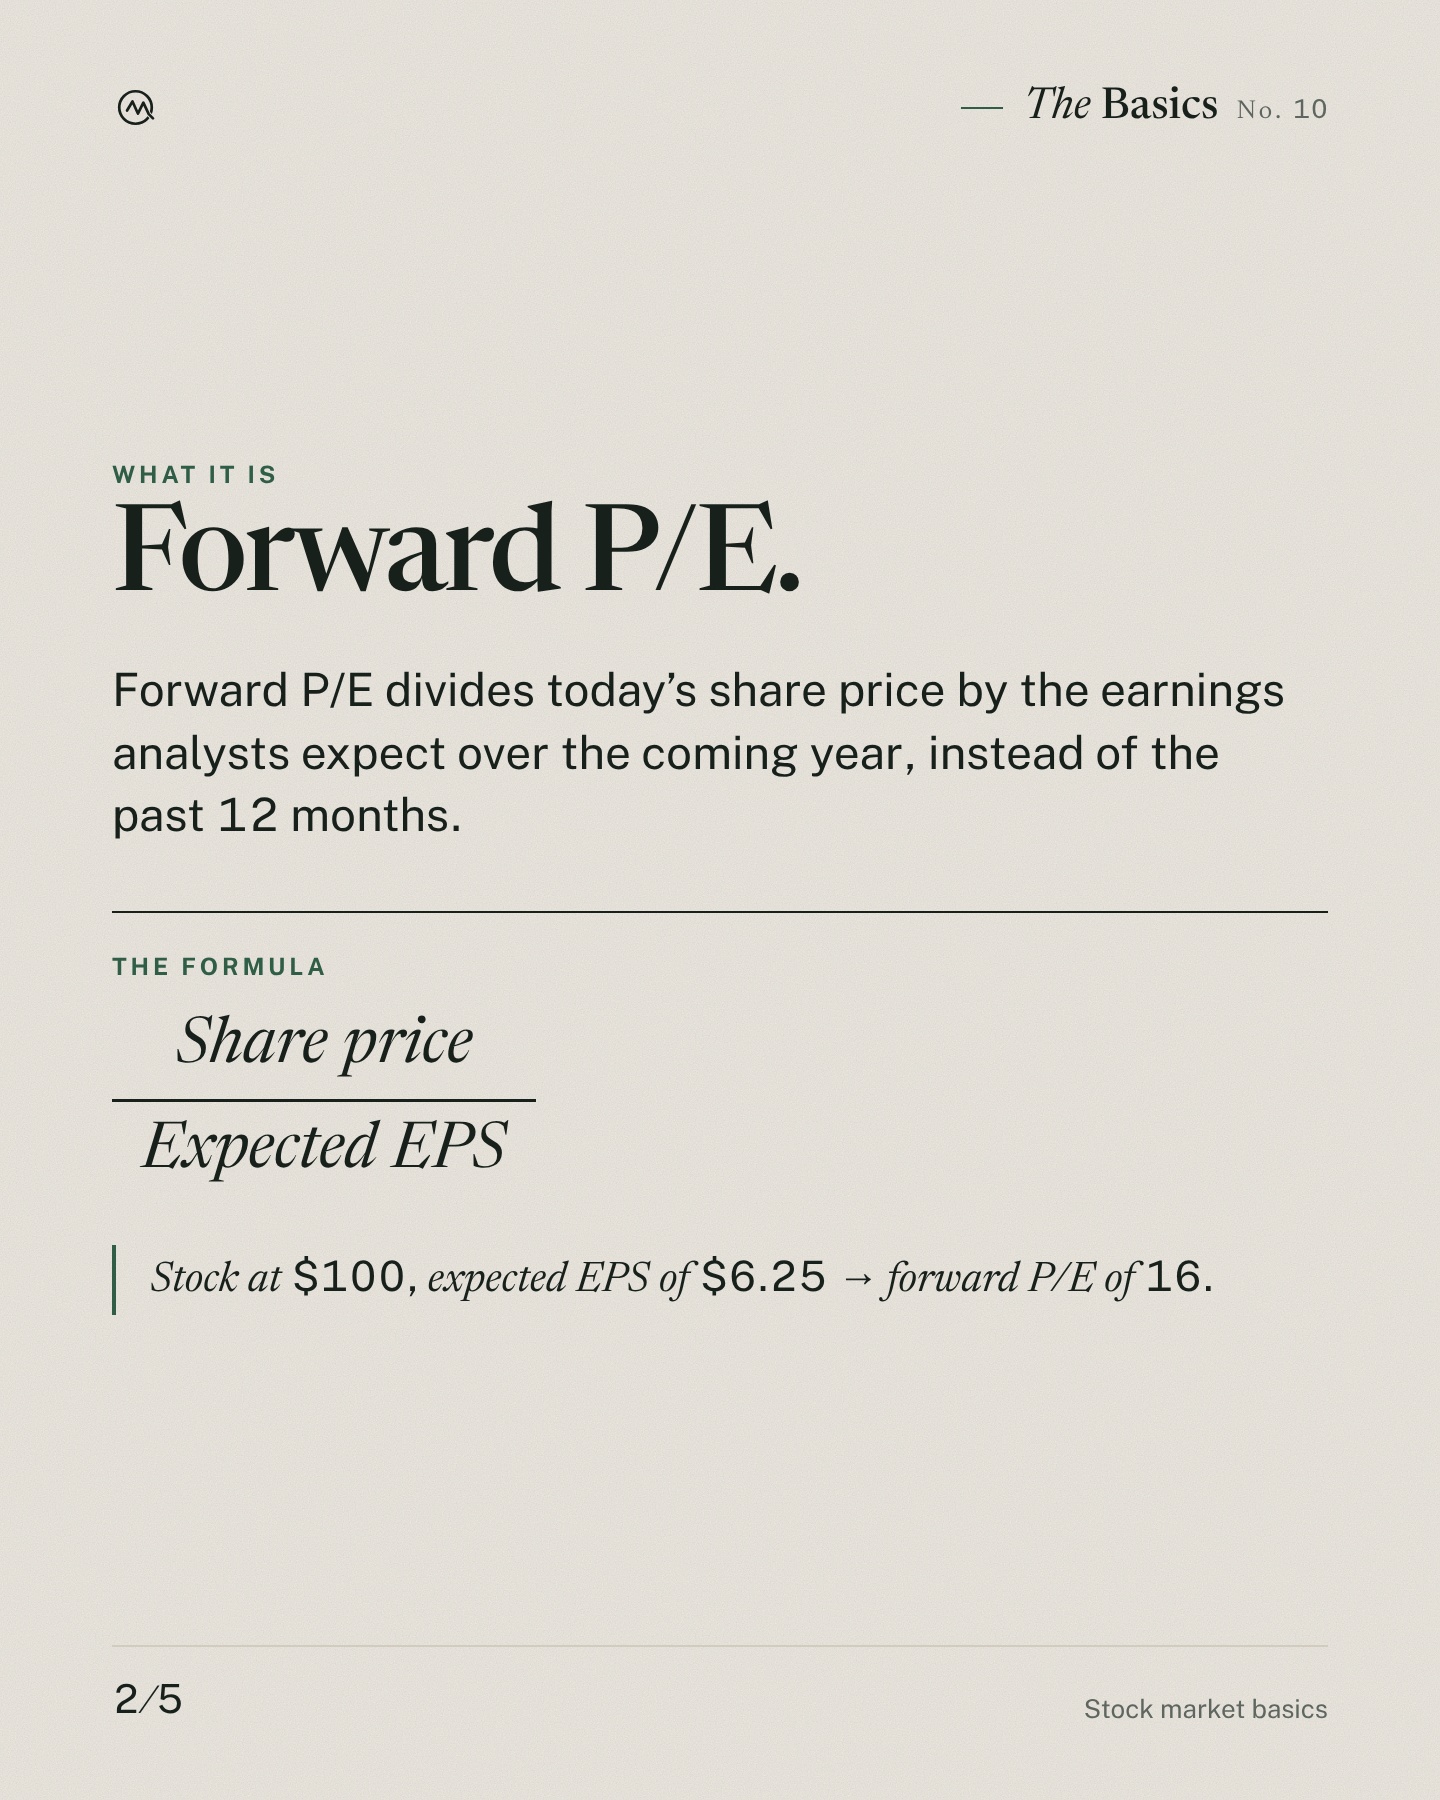
Forward P/E divides today’s share price by the earnings analysts expect over the coming year, instead of the past 12 months.
Share price ÷ Expected EPS
Stock at $100, expected EPS of $6.25 → forward P/E of 16.
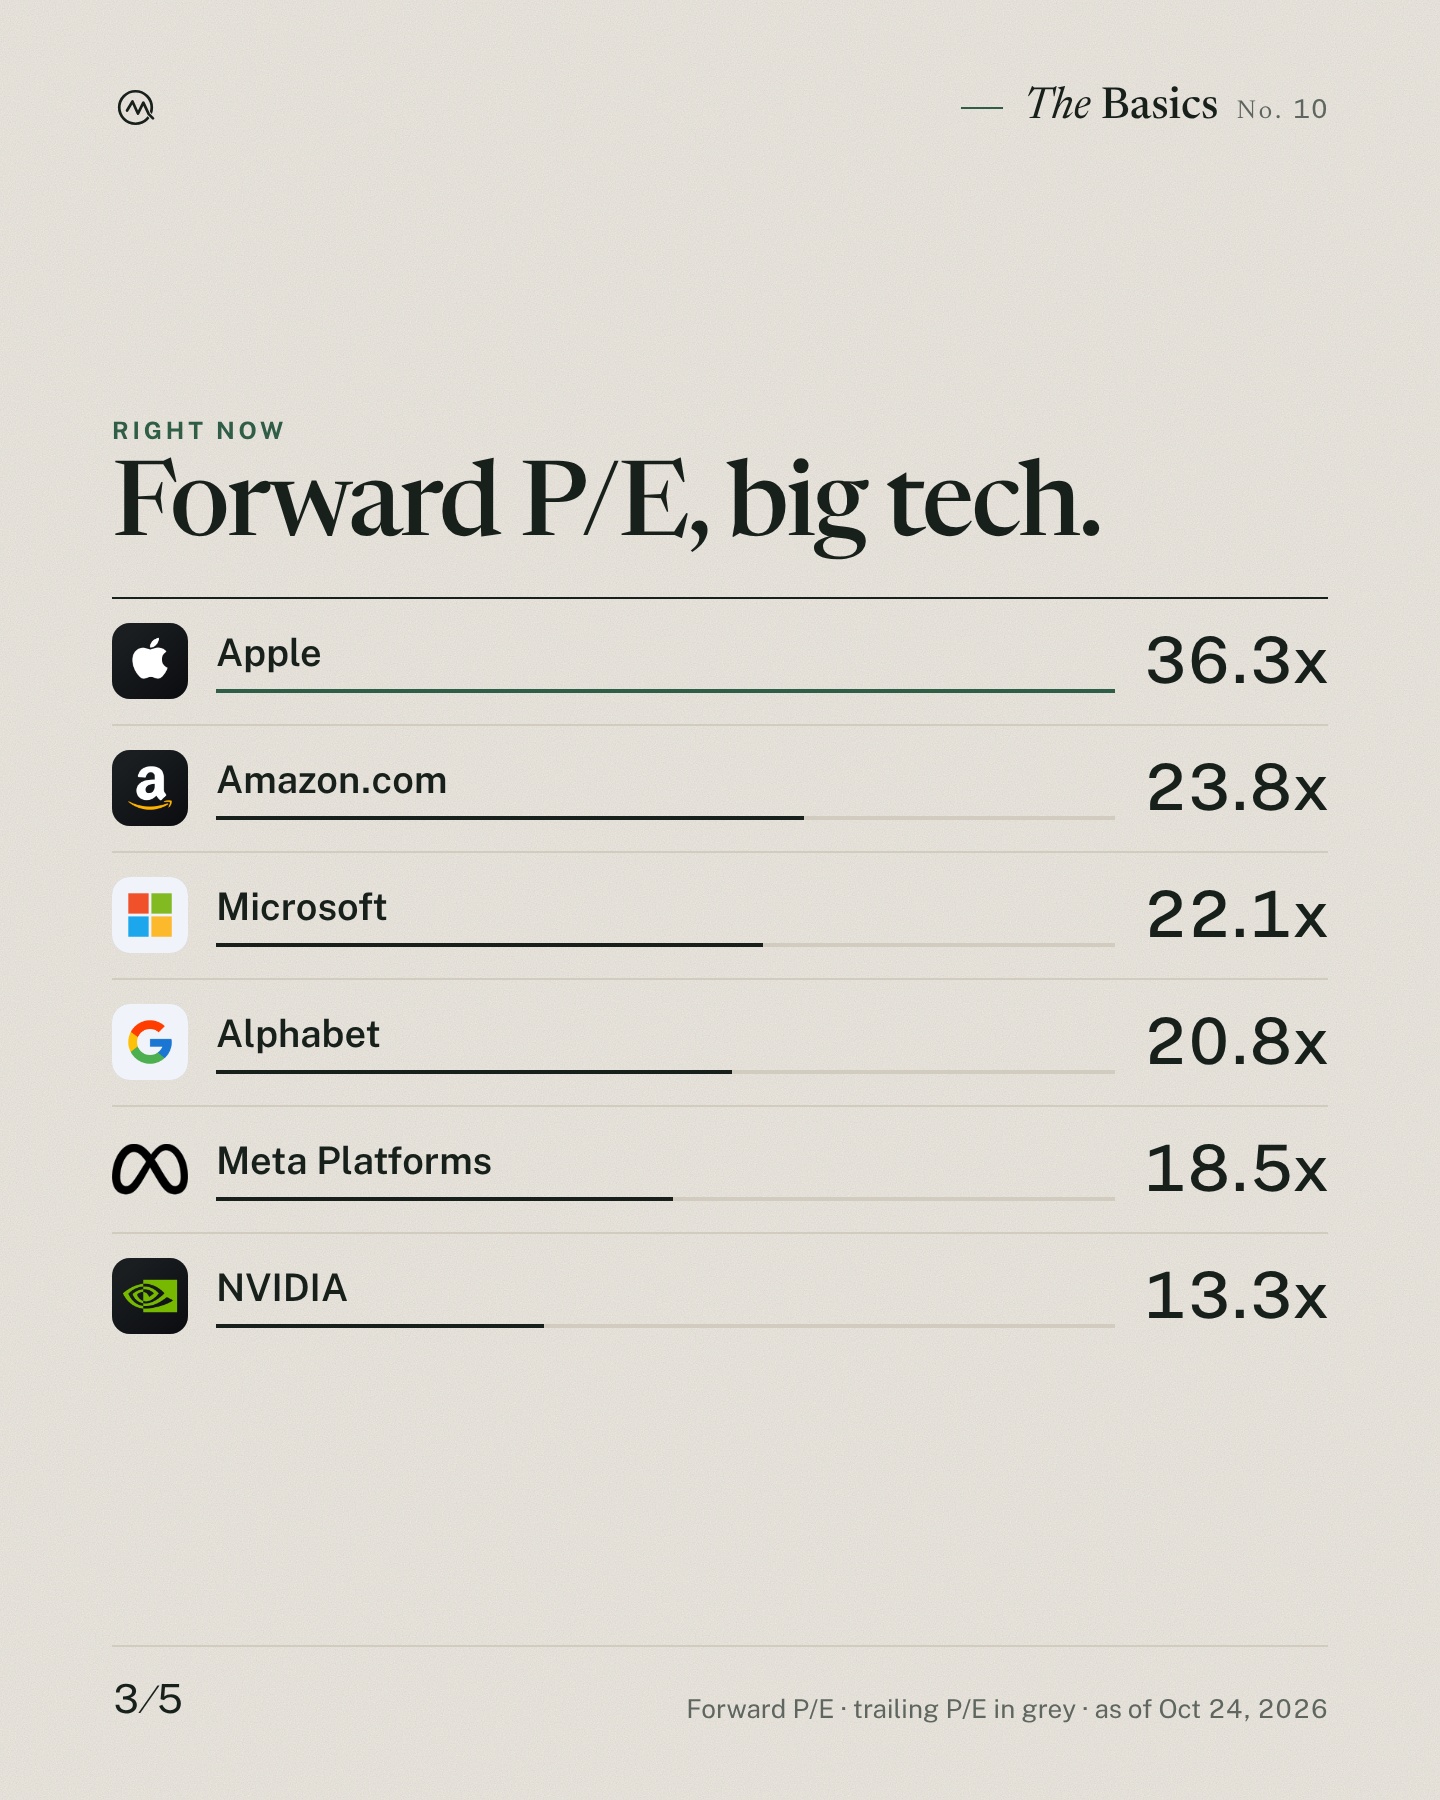
Right now:
$AAPL 36.3x
$AMZN 23.8x
$MSFT 22.1x
$GOOGL 20.8x
$META 18.5x
$NVDA 13.3x
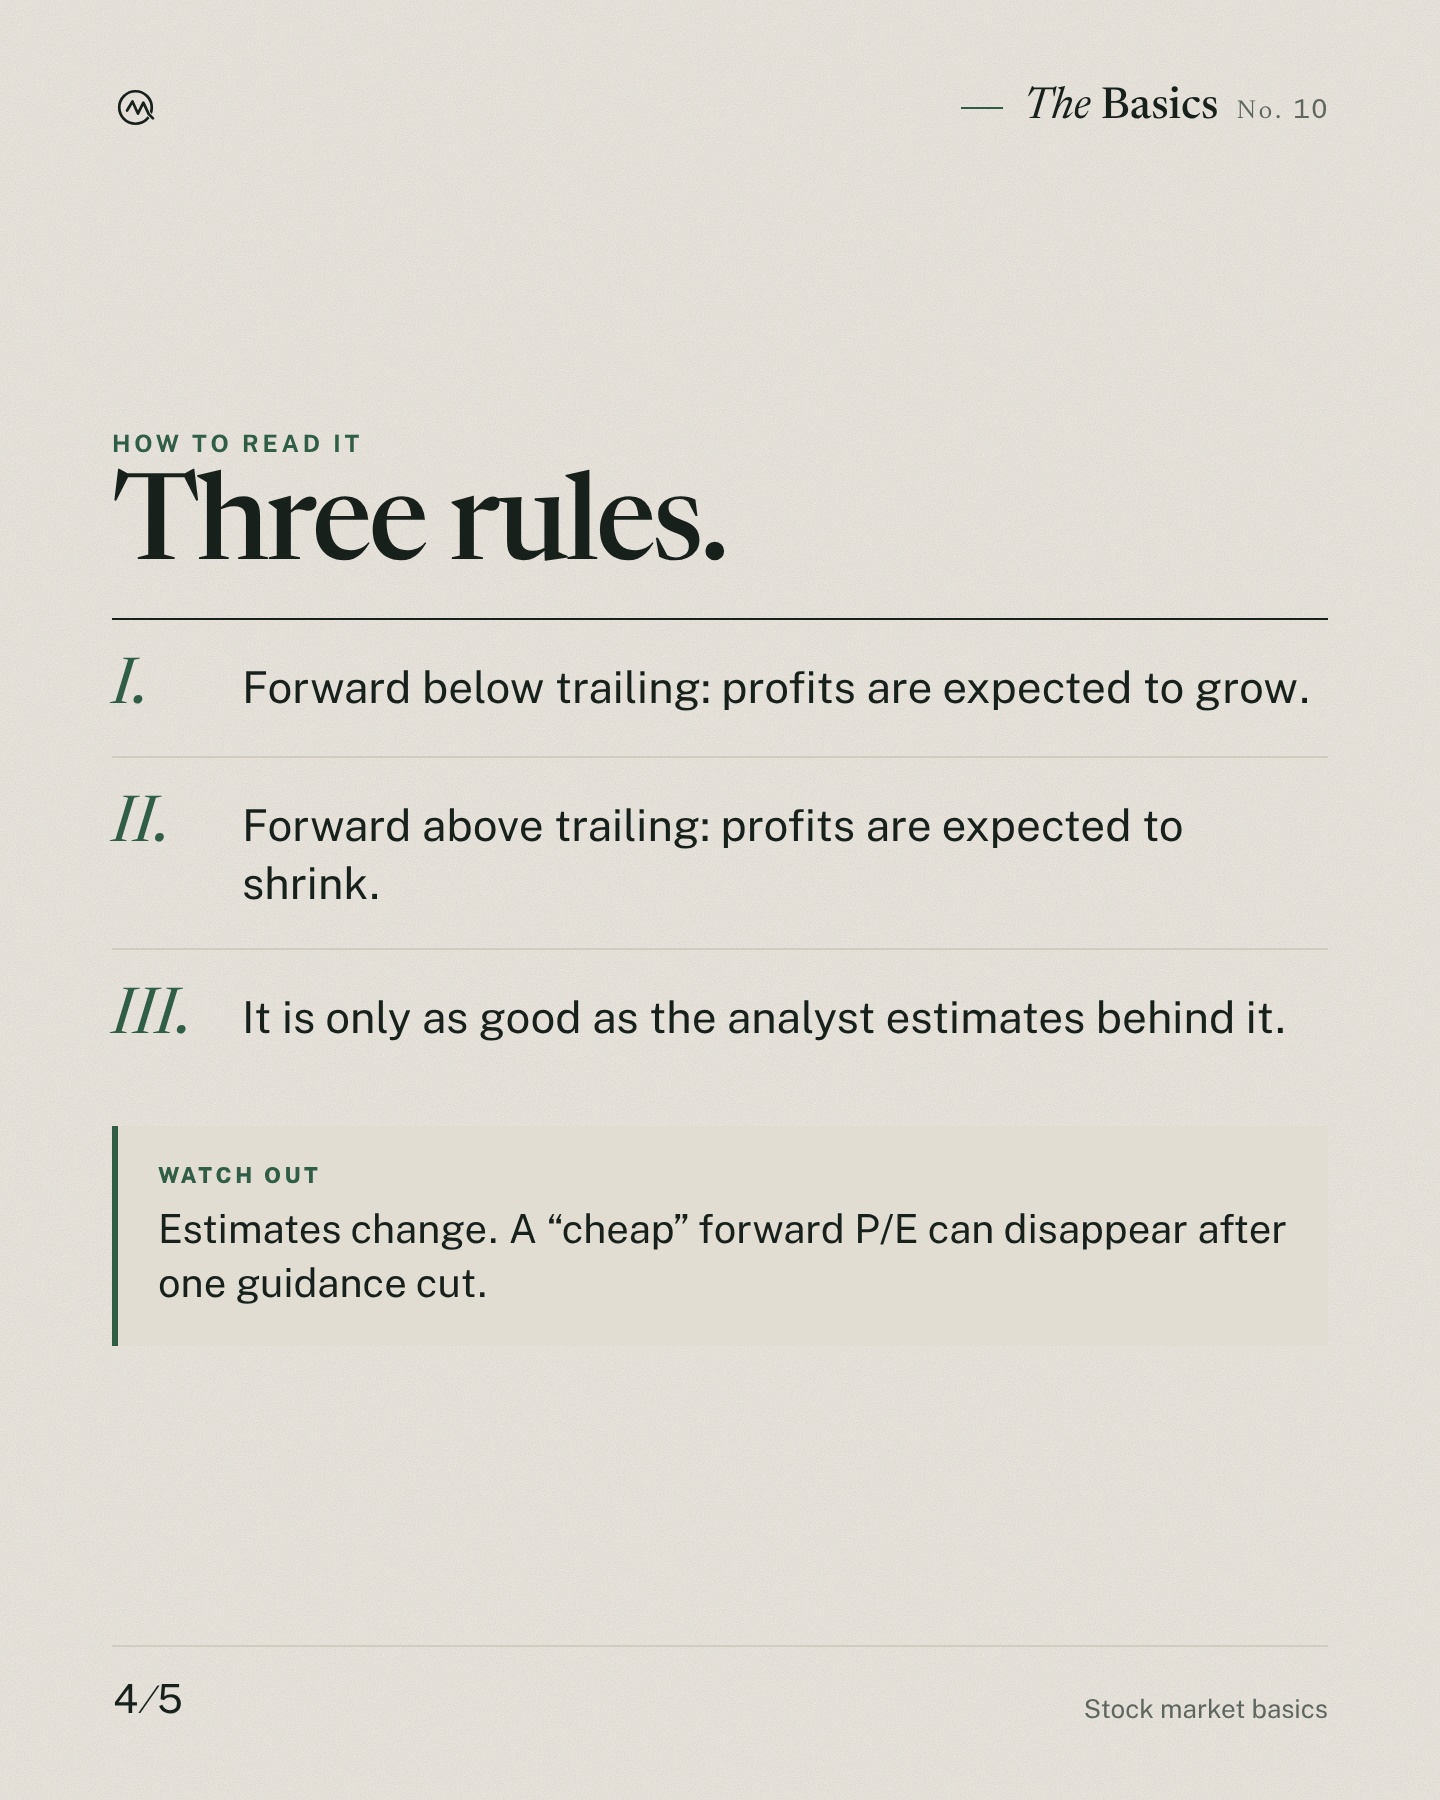
How to read it:
• Forward below trailing: profits are expected to grow.
• Forward above trailing: profits are expected to shrink.
• It is only as good as the analyst estimates behind it.
Watch out: Estimates change. A “cheap” forward P/E can disappear after one guidance cut.
Next up: CPI, the inflation report.
Education only. Not financial advice.
0 likes
Posted on Nexqual Sonar — the social network for the stock market. Not financial advice.