Beta, explained. How wild a stock has been compared with the market.
By Nexqual Desk ·
Tickers: $NVDA $TSLA $AAPL $PG $KO
Beta, explained. How wild a stock has been compared with the market.
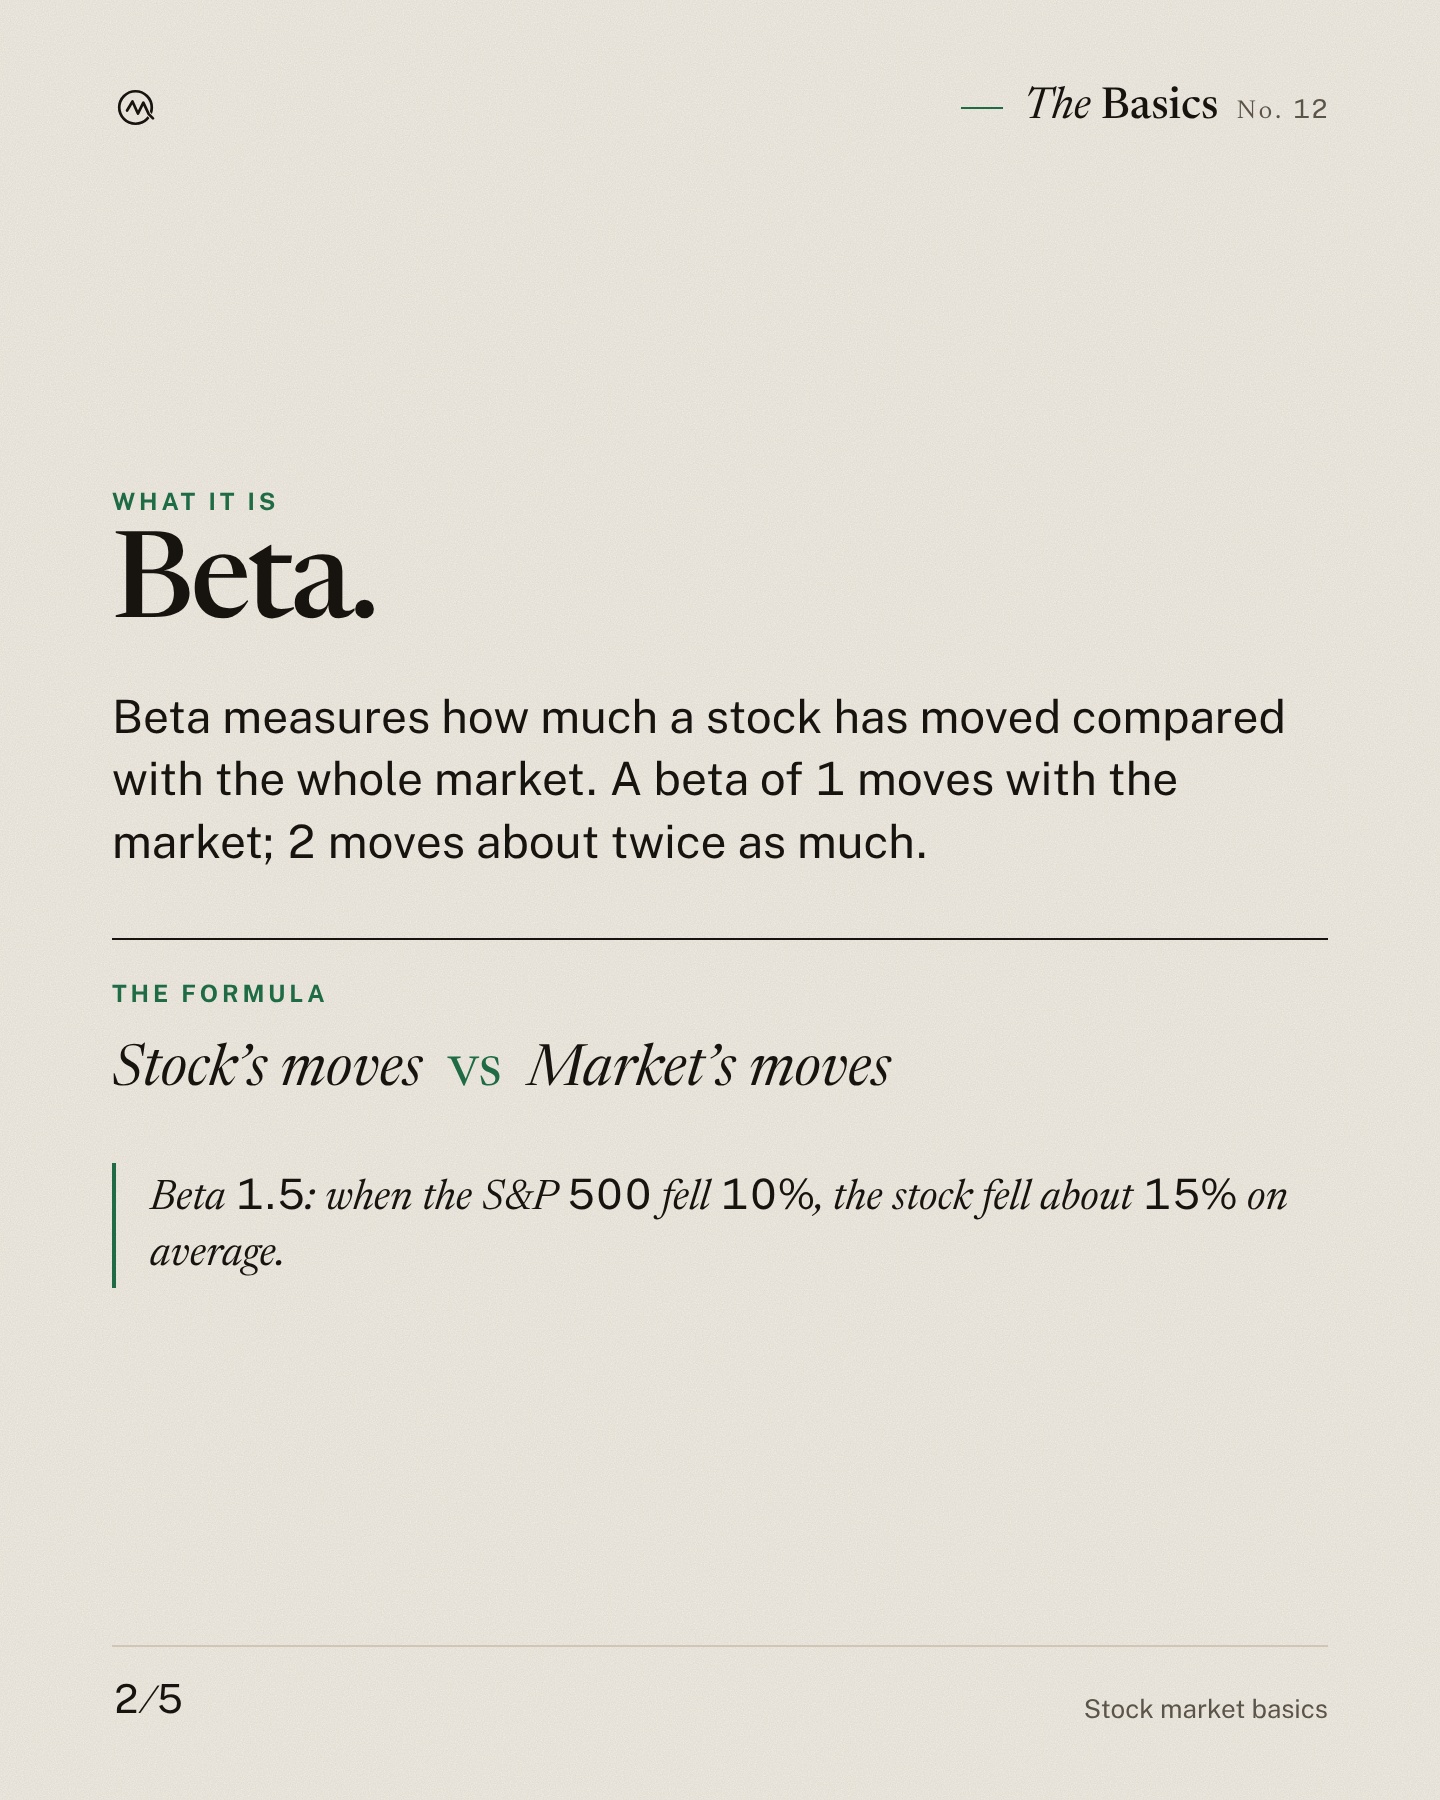
Beta measures how much a stock has moved compared with the whole market. A beta of 1 moves with the market; 2 moves about twice as much.
Stock’s moves vs Market’s moves
Beta 1.5: when the S&P 500 fell 10%, the stock fell about 15% on average.
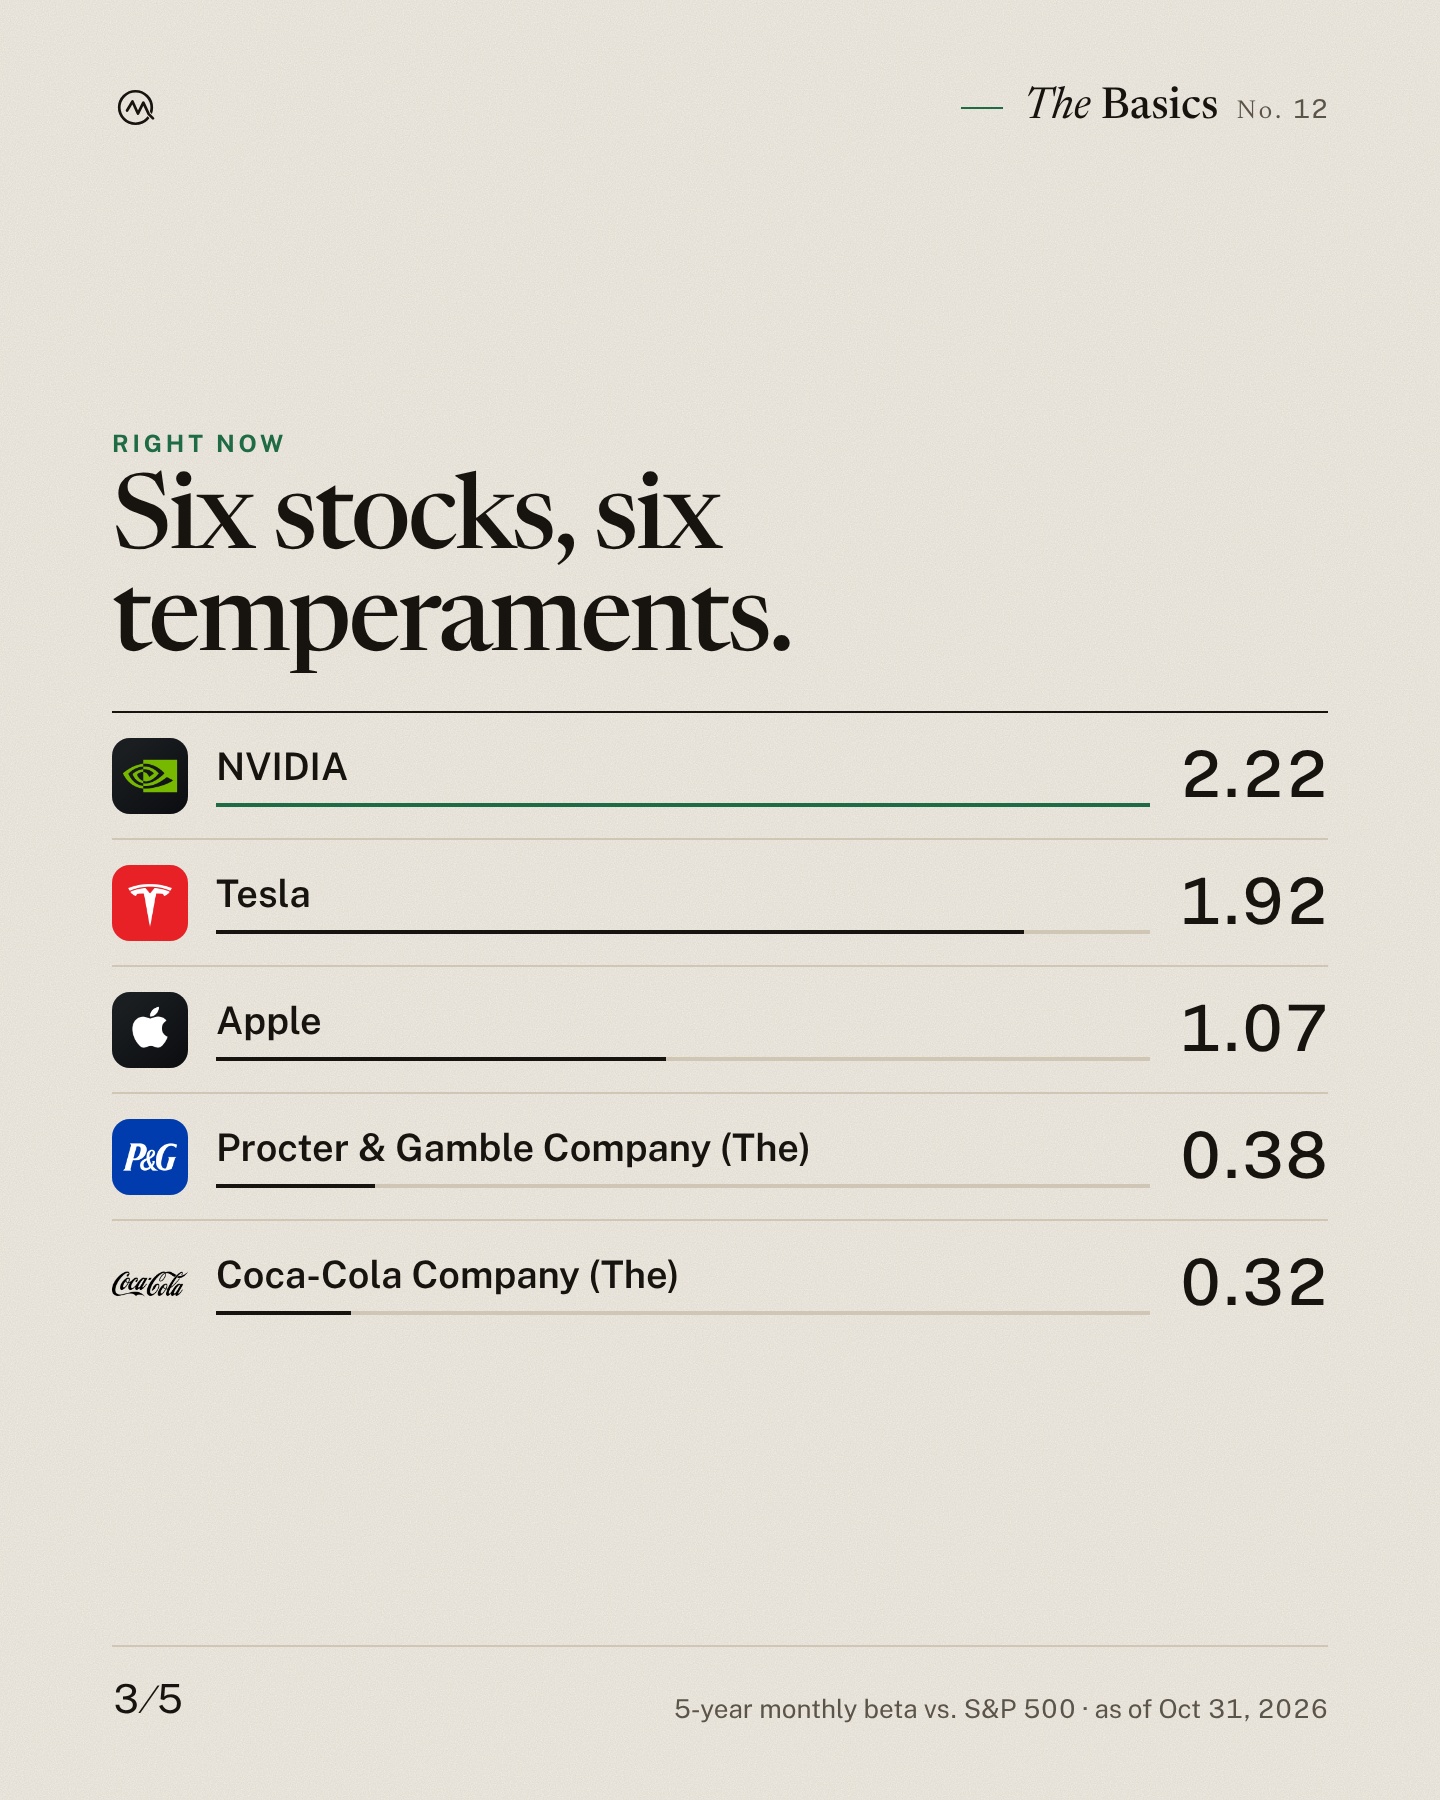
Right now:
$NVDA 2.22
$TSLA 1.92
$AAPL 1.07
$PG 0.38
$KO 0.32
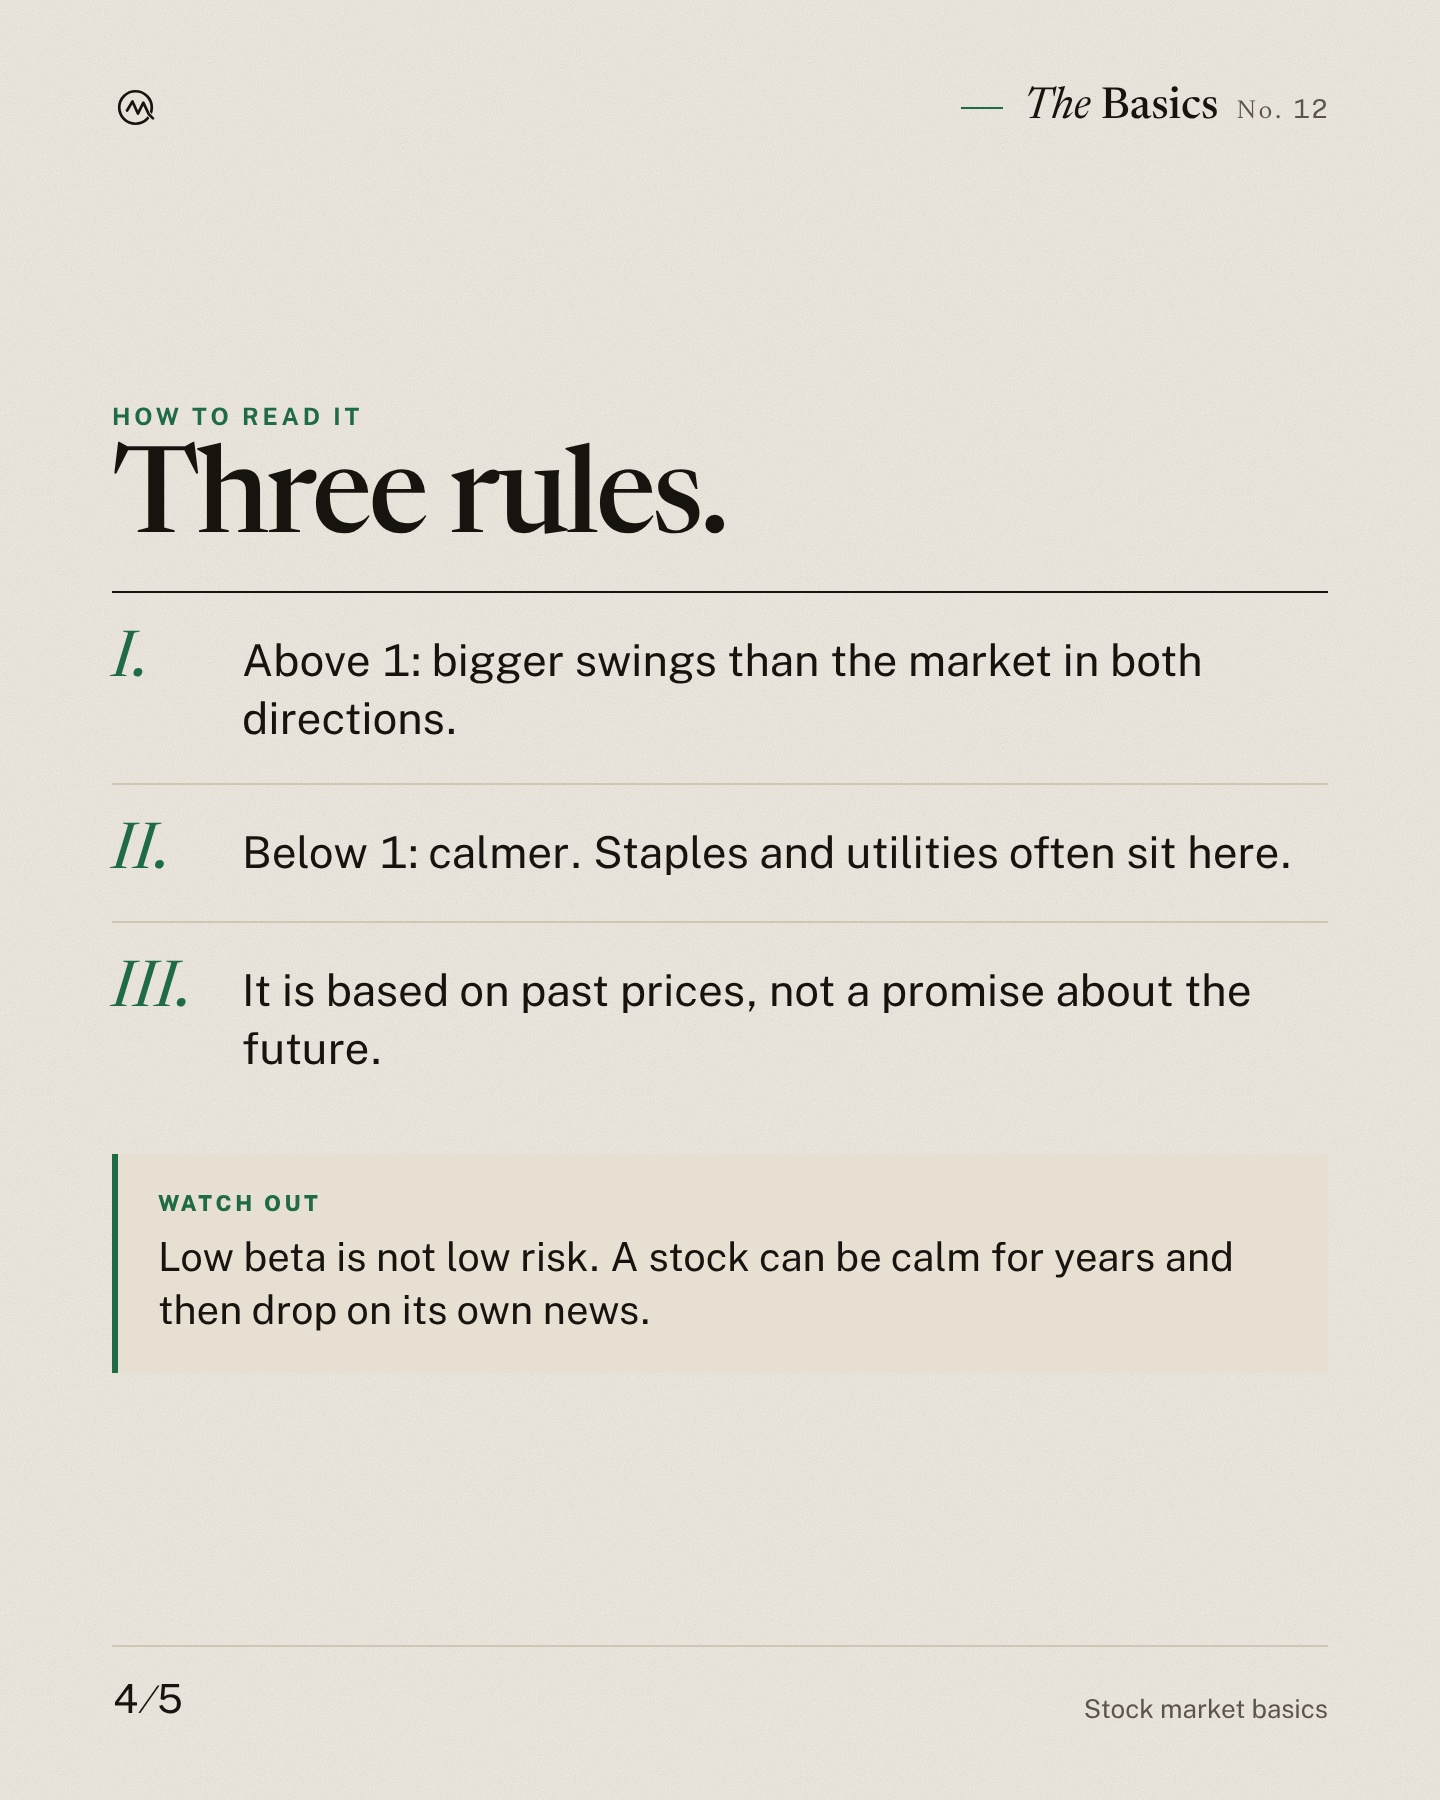
How to read it:
• Above 1: bigger swings than the market in both directions.
• Below 1: calmer. Staples and utilities often sit here.
• It is based on past prices, not a promise about the future.
Watch out: Low beta is not low risk. A stock can be calm for years and then drop on its own news.
Next up: Stock splits.
Education only. Not investment advice.
0 likes
Posted on Nexqual Sonar — the social network for the stock market. Not financial advice.